From Wireshark to AI: Root Cause Analysis at Kubernetes Scale

Manual, visual RCA processes do not scale in Kubernetes. The traffic volume is too high, the environment is too dynamic, and the tooling was built for a different era.
AI can process orders of magnitude more than visual analysis. Network data is likely the most authoritative source of truth in any Kubernetes cluster, however, until now, it was challenging to include network data in an AI-driven RCA process.
The Traditional Workflow
tcpdump + Wireshark
tcpdump to capture. Wireshark to analyze. This workflow has been the standard for network forensics for decades — and on a single machine, it remains unmatched.
In a Kubernetes environment with dozens of nodes, hundreds of pods, and an order of magnitude more east-west traffic, the process looks like this:
- Provision and run tcpdump on the relevant node(s)
- Copy the PCAP to a workstation with Wireshark
- Analyze with Wireshark — visually inspect the packet stream
- Repeat — for every other node involved
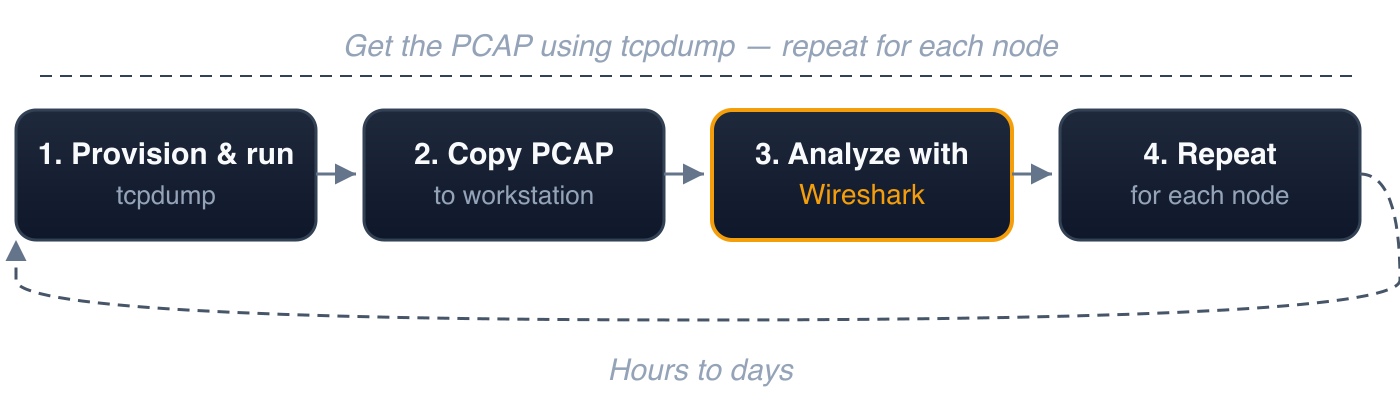
Typical time to root cause: hours to days.
Manual RCA Doesn't Scale
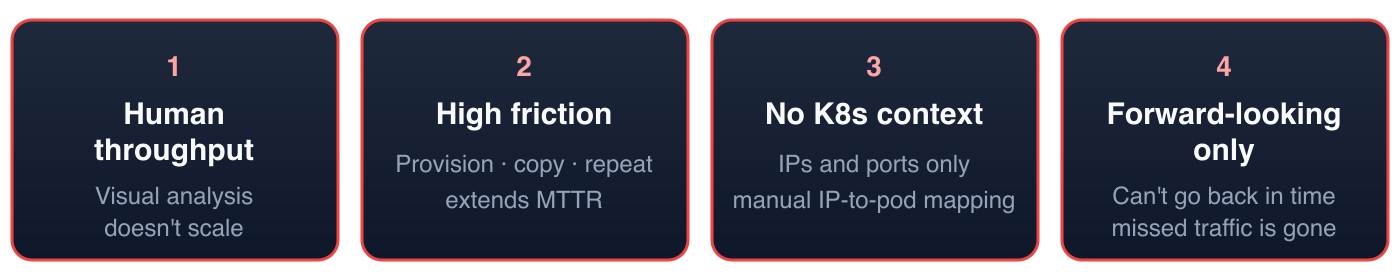
1. Human throughput is the bottleneck. There is a finite amount of information a human can process through visual analysis of network traffic. Wireshark is a powerful tool, but the constraint is the operator. Kubernetes clusters generate orders of magnitude more traffic than a single server. No engineer can visually parse that volume.
2. High friction, slow iteration. Each cycle — provision, capture, copy, open, filter, correlate — takes time. Multiply by every node involved. During an active incident, this operational overhead directly extends mean time to resolution (MTTR).
3. No Kubernetes context. Wireshark operates at the network layer: IP addresses and ports. It has no awareness of pods, namespaces, services, or labels. In Kubernetes, where IPs are ephemeral and workloads are rescheduled continuously, every IP in a PCAP must be manually mapped to a workload identity via kubectl get pods -o wide — using state from the time of the incident, not the current state.
4. Forward-looking only. tcpdump captures traffic from the moment it's started. If the incident already occurred, the relevant traffic is gone. This requires three conditions to align simultaneously: the symptom must recur, tcpdump must be provisioned and running, and the capture must be scoped to a manageable size. In production Kubernetes environments, this alignment is unlikely.
AI Can Process Orders of Magnitude More Than Visual Analysis
AI agents can process far more network data than any human performing visual analysis. The throughput gap between machine processing and human visual inspection is orders of magnitude.
However, raw PCAP files are impractical for AI consumption. A single hour of cluster traffic can produce gigabytes of binary packet data. The token cost is prohibitive, and the format is not structured for machine reasoning. AI performs best on structured data that is relatively small in size.
Even if the format problem were solved, the remaining shortcomings persist: the friction of capturing PCAP files, the storage requirements, the absence of Kubernetes context, and the inability to look backwards.
The solution is not simply adding AI to the existing workflow. It requires a fundamentally different pipeline — how traffic is captured, stored, enriched, and presented to an AI agent.
Enter Kubeshark
The "Google Search Engine" for Kubernetes Network Traffic
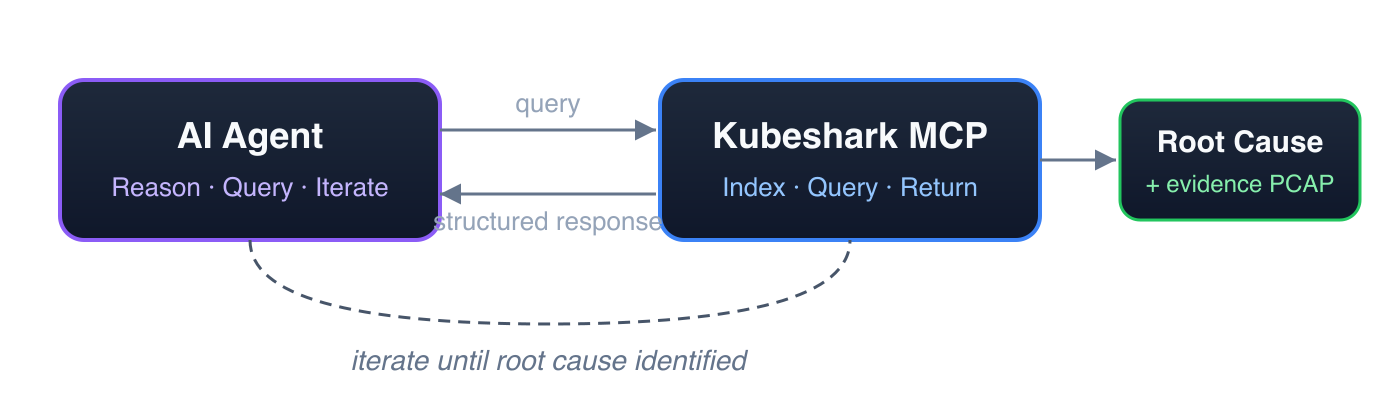
Kubeshark indexes cluster-wide network traffic so AI agents can query any part of it using API and Kubernetes semantics — not raw packet offsets. Responses are quick, structured, token-efficient, and small. This enables AI agents to execute a series of targeted queries — iterating, narrowing, and refining — en route to identifying the root cause.
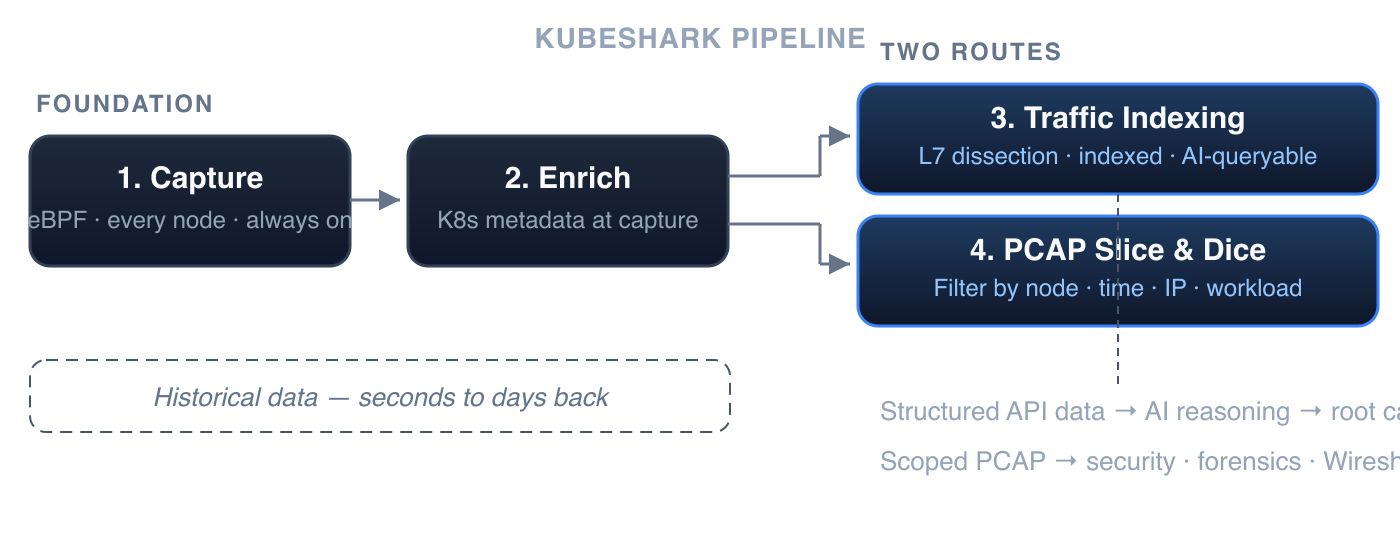
1. Continuous Cluster-Wide Capture
A lightweight eBPF-based agent on every node continuously captures all TCP and UDP traffic into a per-node rolling buffer. Traffic from any point within the retention window is available for analysis — retrospectively.
Storage is managed and configurable. The rolling buffer size determines the retention window — from minutes to days — with a predictable, fixed storage footprint per node.
2. Kubernetes-Native Enrichment
Every packet is correlated with Kubernetes metadata at capture time: pod name, namespace, service, node, and labels. Workload identity is resolved at the point of capture, eliminating the need for manual IP-to-pod mapping.
Both of the following routes operate on this continuously captured, Kubernetes-enriched, historical data — whether the incident happened seconds ago or days ago.
3. Traffic Indexing — Searchable by API and Kubernetes Semantics
This is the search engine layer. On demand, Kubeshark performs delayed dissection: matching requests to responses, dissecting each element of an API call according to its protocol specification, and indexing every field. The result is a fully indexed, queryable representation of the cluster's API traffic — optimized for fast, precise queries by both AI agents and humans.
For example, to retrieve all API calls involving pods with a specific label:
local_labels.app == "payment" || remote_labels.app == "payment"This matches API calls from or to any pod with label app=payment. Because all API elements are indexed, responses are fast. To drill further:
local_labels.app == "payment" && http && status_code >= 500 && dst.pod.namespace == "production"This returns only HTTP 500+ errors from payment pods targeting the production namespace — with full request/response payloads. Queries can be made arbitrarily more complex — combining protocol, method, URL pattern, headers, status codes, latency thresholds, pod labels, namespaces, and time ranges. Responses remain fast regardless of complexity, because all API elements are indexed.
4. PCAP Slice and Dice — Filtered, Scoped, Export-Ready
The indexing route (above) serves AI-driven querying and reasoning. A second route operates directly on the raw PCAP data — for use cases where the PCAP file itself is the deliverable.
AI agents can slice and dice cluster-wide PCAP content, filtering by nodes, time window, IP addresses, ports, and Kubernetes workload identity. The result is a precisely scoped, Wireshark-compatible PCAP file — reduced from gigabytes of cluster-wide traffic to only the relevant packets.
This is the route for:
- Security scanning — extract PCAP for a specific time window and feed it to IDS/IPS or threat detection tools
- Forensic archival — export evidence-grade PCAP scoped to the incident, ready for compliance and long-term retention
- Vendor escalation — produce a focused PCAP proving a specific behavior, without exposing unrelated cluster traffic
- Deep packet inspection — hand a filtered PCAP to Wireshark for byte-level analysis of specific connections
Summary
Network data is the most authoritative source of truth in any Kubernetes cluster. The barrier has never been the data — it has been the ability to capture, enrich, and analyze it at the scale and speed that incidents demand.
If you're not using an AI-driven RCA workflow, you should be. Human-operated, visual RCA processes do not scale — not with the volume of traffic Kubernetes generates, not with the speed incidents demand.
The root cause is always in the packets. The question is whether you can get to it in time.
Getting Started
1. Install Kubeshark
helm repo add kubeshark https://helm.kubeshark.com
helm install kubeshark kubeshark/kubeshark
2. Configure MCP
First, install the kubeshark CLI:
brew install kubesharkUsing Claude Code as an example:
claude mcp add kubeshark -- kubeshark mcpIf there's no kubectl access, provide the Kubeshark URL:
claude mcp add kubeshark -- kubeshark mcp --url https://kubeshark.example.comFor Cursor, add to ~/.cursor/mcp.json:
{
  "mcpServers": {
    "kubeshark": {
      "command": "kubeshark",
      "args": ["mcp"]
    } } }
3. Install a Skill (Optional)
Kubeshark provides a network RCA skill that guides AI agents through a structured investigation workflow — from snapshot creation to root cause identification.
Examples
Create a snapshot and investigate:
"Create a snapshot of the last 30 minutes named incident-march-18"
Query for errors:
"Show me all HTTP 500 errors from the production namespace"
Drill into DNS:
"Show me DNS queries from payment-service that returned NXDOMAIN"
Slice and dice PCAP:
"Export PCAP for all traffic involving payment-service between 2:30 and 2:35 PM"
Get the root cause:
"What caused the first 500 error? Trace it back to the originating failure."
Kubeshark provides continuous cluster-wide traffic recording, Kubernetes-enriched packet data, and AI-powered forensic analysis via MCP. Integrates with Claude Code, Cursor, and any MCP-compatible AI tool. Get started →