Kubeshark V2.00: Coming soon!
Kubeshark's first generation (V1.00) has been used in production environments for over two years. With more than 11,000 GitHub stars and 27 million Docker pulls, it became clear that Kubeshark is addressing a real need. At the same time, we realized that we could significantly improve the way Kubeshark handles this need. Based on extensive user feedback, we are preparing to release V2.00—a complete refactor of the original version.
The Problem – Fragmented API Context
Kubernetes is distributed and multilayered, with critical information scattered across the network, the nodes’ operating systems, and the control plane.
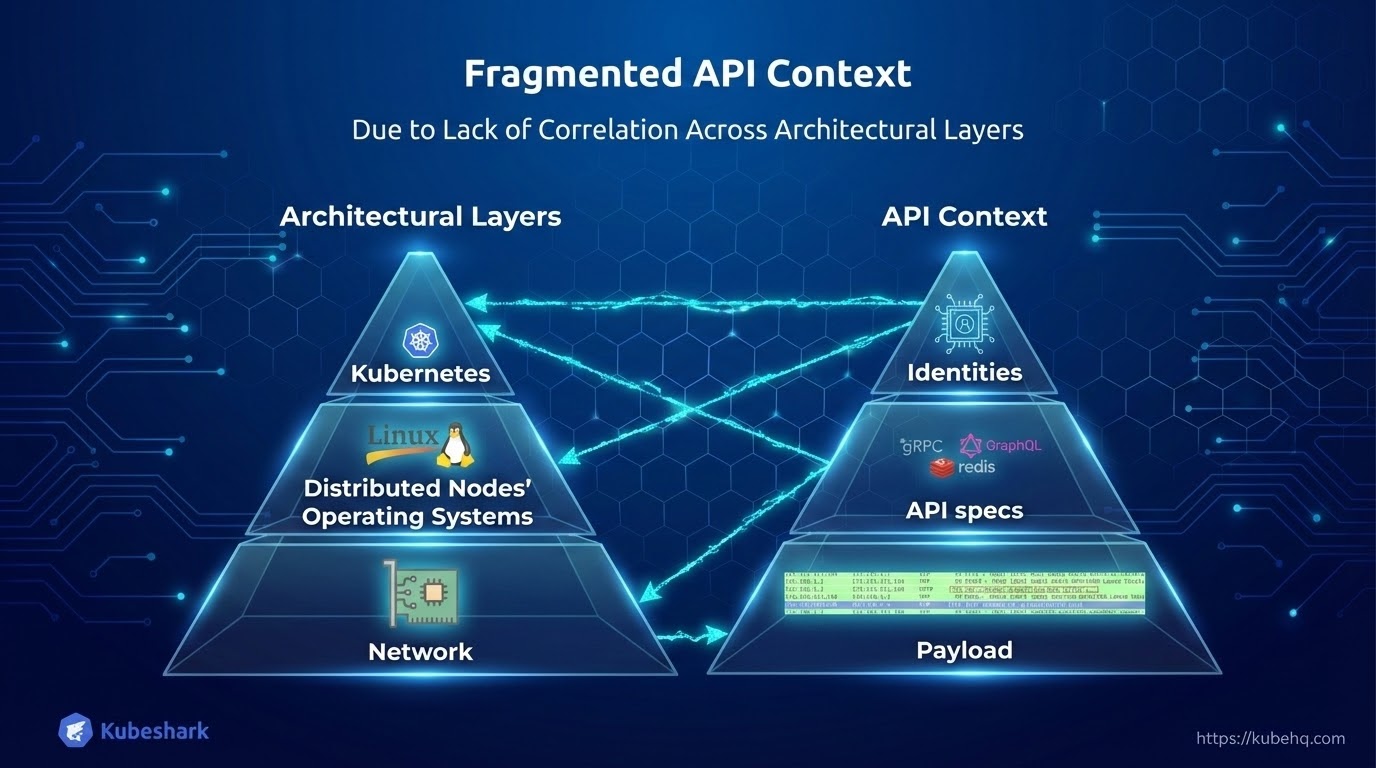
Only by correlating information across all layers can users obtain an accurate and complete picture. Without this correlation, visibility becomes fragmented and incomplete.
The API Context (L7)
Fragmentation is most pronounced at the API layer, where much of the API context resides within the network and is distributed across multiple L4 streams. The network is large, highly distributed, and less accessible than other parts of the infrastructure, making it difficult to reconstruct complete API context without correlating data across layers and focusing analysis at the network level.
API Dissection
Reconstructing the API Context by Correlating Information from All Layers
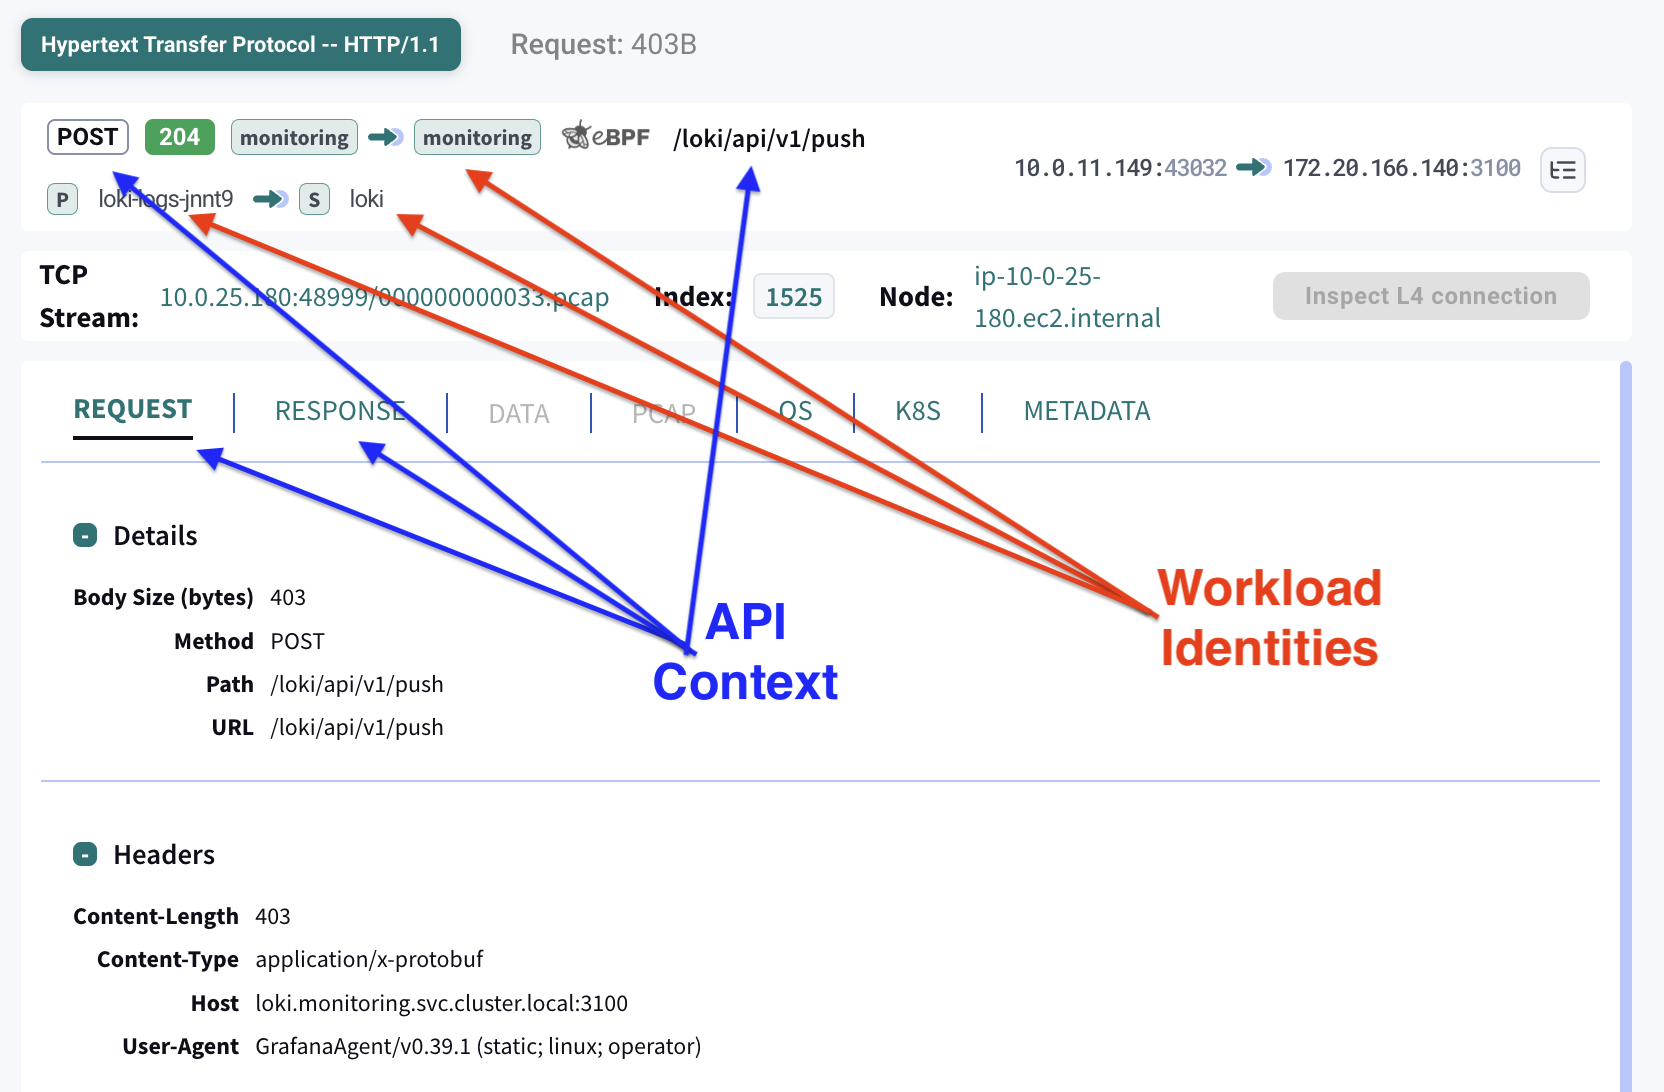
API dissection goes beyond basic traffic inspection. It reconstructs complete API calls from network data by identifying requests and responses, protocol metadata, and payloads.
This process requires buffering both ingress and egress traffic between two peers, matching requests to responses, detecting the underlying protocol, and parsing payloads according to the protocol specification.
Once API calls are successfully dissected, each call is enriched with workload and application identities. These identities are derived by correlating Kubernetes events from the Kubernetes API server with operating system context collected from distributed nodes via eBPF. The result links each API call to its originating pod, service, namespace, labels, and, when available, the specific process that generated the traffic.
Unlike raw packet data, which lacks higher-level context, API dissection provides structured, semantically meaningful information.
Completeness of Information
Retaining a Complete Record of L4 Traffic (PCAP)
With V1.00, we learned that relying solely on real-time API dissection (L7) provides an incomplete picture. Real-time dissection depends heavily on protocol support, strict adherence to specifications, and the availability of sufficient compute resources.
Following feedback from hundreds of users, it became clear that access to the full picture is critical—regardless of protocol support, packet loss, or compute constraints. This led to a clear design goal for V2.00: retain a complete account of all L4 traffic (PCAP).
In V2.00, we inverted the information model. Instead of starting with the API layer (L7), we start at L4 by capturing and making all network flows available for inspection—each representing a communication channel between a source and a destination. API dissection (L7) is then applied on top of L4, based on protocol support.
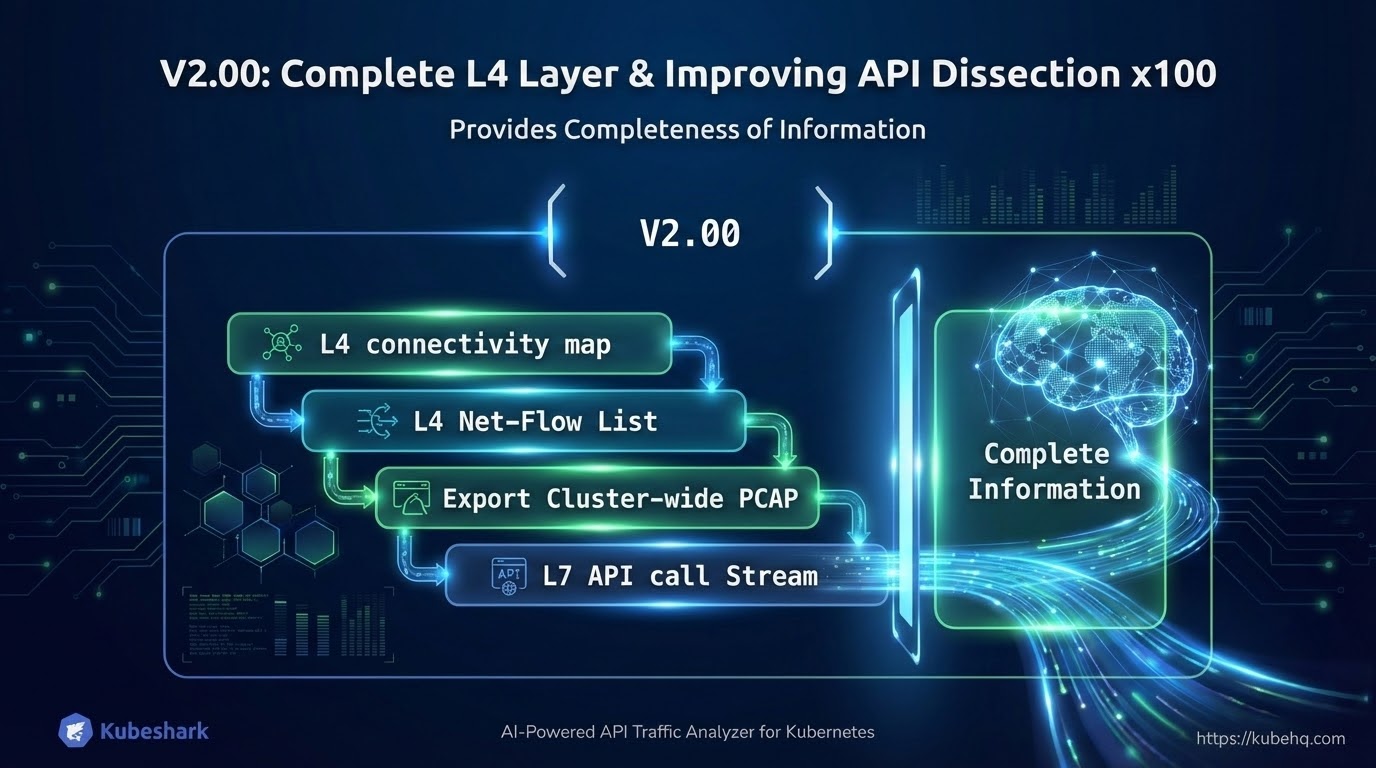
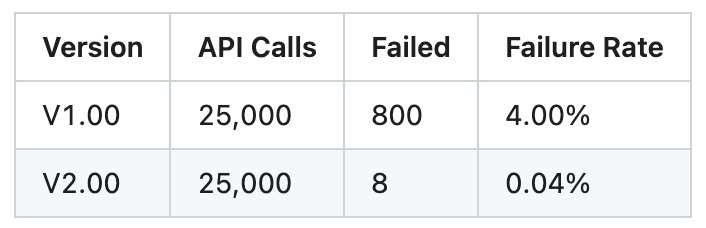
Through bug fixes and code optimizations, we were able to improve API dissection in V2.00, reducing API dissection failures by 100×.
In a test involving 25,000 API calls, the number of failed dissections dropped substantially:
Raw Packet and Event Capture — The Single Source of Truth
We concluded that raw packet and event capture is the single source of truth. As long as all traffic and relevant events are captured, it becomes possible to preserve complete information and improve dissection outcomes.
V2.00 captures and retains all packets and relevant events across all three layers: the network, Kubernetes, and the operating system. Capture is designed to operate with minimal resource usage to reduce the risk of packet loss due to insufficient compute. Any resource-intensive processing is deferred to later stages and executed on non-production resources.
Captured artifacts can be used for API dissection when supported and automatically fall back to L4 inspection when dissection is not possible.
By preserving raw data and avoiding early data loss, V2.00 ensures visibility at the L4 level and significantly improves overall API dissection success rates.
Production Compute Constraints
Recognizing that production compute is both expensive and limited, V2.00 meticulously designs packet capture for minimal resource usage in production. Compute-intensive analysis is strategically shifted to non-production environments. Our objective is to successfully capture all traffic with a negligible impact on production workloads.
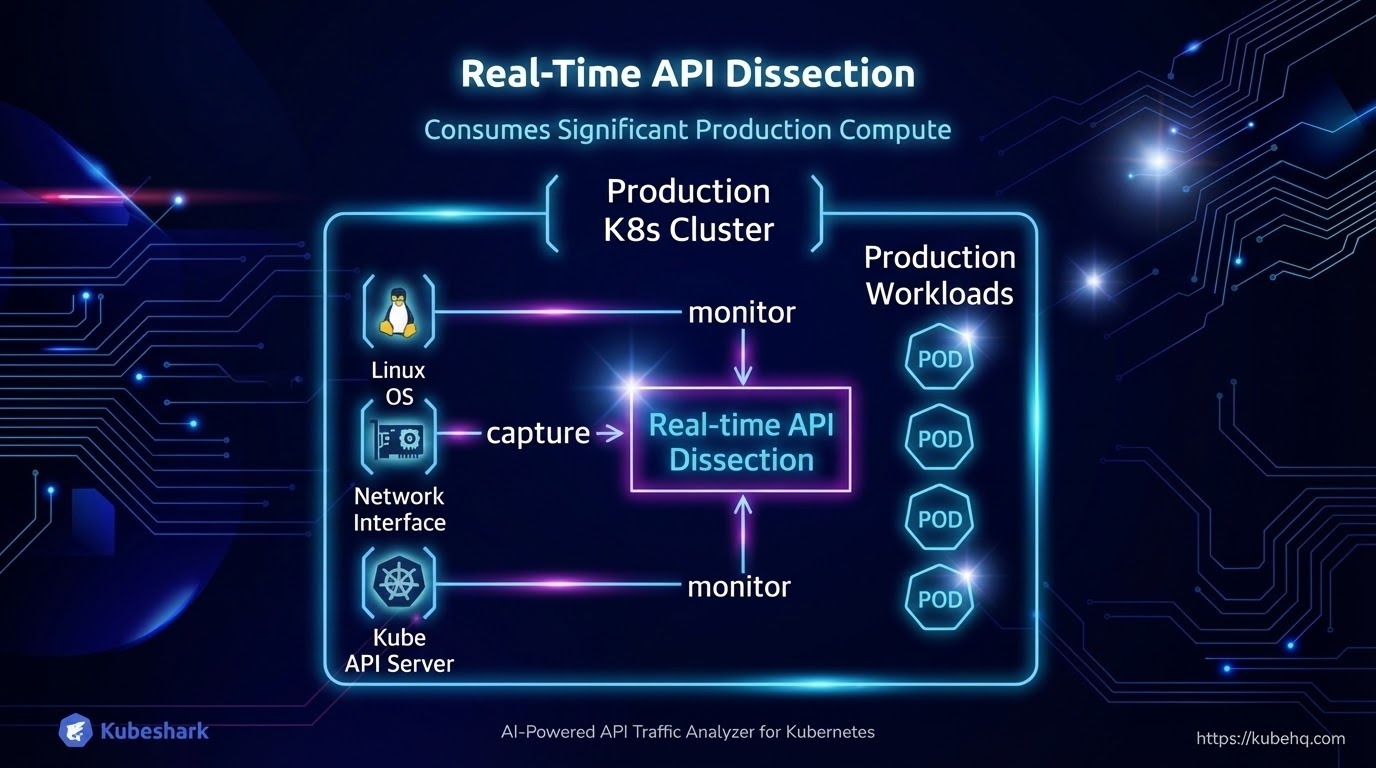
Real-time API Dissection is a Resource-Intensive Process
Dissecting cluster-wide traffic, Kubernetes and Operating System events into API calls requires substantially more CPU and memory than simple packet capture. Across two years of V1.00 deployments in production environments, one pattern was consistent: real-time API dissection accounted for most of the resource usage, while traffic capture itself remained comparatively lightweight.
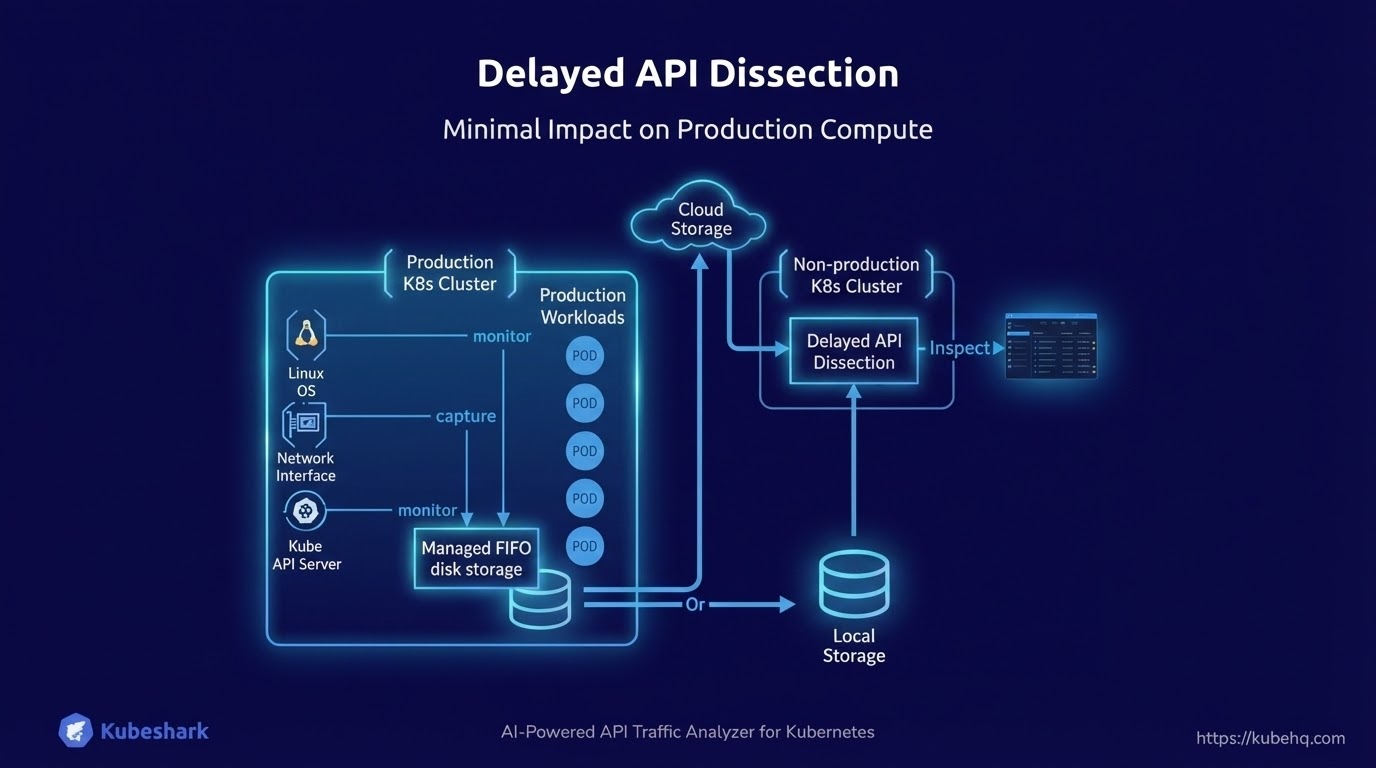
Delayed API Dissection — Minimum Impact on Production Compute
Recognizing that CPU and memory consumption is a critical factor, we introduced an additional approach in V2.00: delayed API dissection, alongside real-time dissection.
With delayed API dissection, traffic is captured on production nodes with minimal overhead, stored, and later dissected on non-production compute. The resulting insight may be generated shortly after capture or at a later time, depending on the workflow, while keeping the impact on production workloads low.
Real-time API dissection remains important, so it is still available and now more efficient in V2.00. Users can run delayed API dissection continuously and enable real-time dissection on demand.
The chart below shows the results of a load test at a rate of 300 API calls per second:
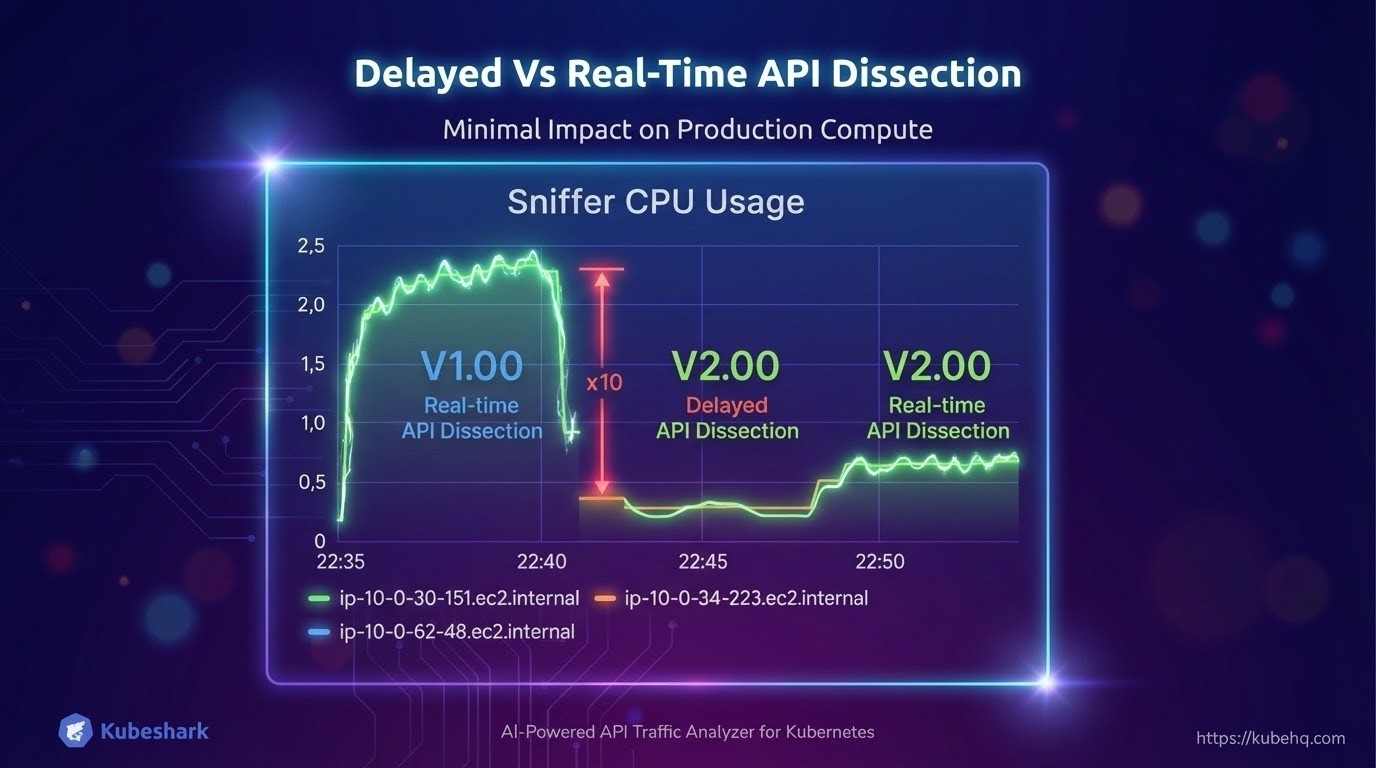
Actual gains vary by workload and are often substantially higher. Most of the heavy lifting in V2.00 involves writing data to disk, which is far less resource-intensive than real-time parsing.
AI-Powered Network Investigation & Analysis
The network generates vast amounts of data critical for identifying performance bottlenecks, application bugs, and security issues. However, effectively leveraging this information is challenging due to the sheer size of it.
Kubeshark structures and compresses network data, enabling AI-driven, iterative investigation. This allows users to explore emergent behaviors, identify anomalies, and trace root causes, while also empowering AI to execute actions within Kubeshark.
Examples of AI actions include:
- "Why are connections to the frontend service occasionally breaking?"
- "Identify all unhealthy TCP flows and create a PCAP file."
- "Create an AI-based load-test for the frontend service."
- "Generate OpenAPI specifications for all services in the sock-shop namespace."
As network data is retained, stored traffic can be processed offline and in batches, allowing both users and AI systems to analyze historical data and run investigations on demand.
Kubeshark exposes an MCP server that provides access to raw traffic, as well as digested and aggregated insights for specific traffic scopes. This makes retained network data usable for deeper analysis.
As a result, the large volume of captured network information can be leveraged to identify emergent trends, detect anomalies, and support incident and root-cause analysis.
More to come in a dedicated article.
In Summary
Following extensive user feedback, after two years of V1.00 running in production, we are preparing to release V2.00—a complete refactor of the original version.
Kubeshark V2.00 consumes far fewer compute resources, with minimal impact on production compute, allowing users to run it continuously in the background while retaining a complete record of L4 (PCAP) traffic for later inspection.
Retained traffic can be investigated, analyzed, and inspected in real time, periodically or after an incident is reported.
While the information within the network is extremely valuable, the network itself is distributed and massive, and access to this information was not readily available until now. Users no longer need to settle for statistics and metrics alone, as Kubeshark makes network-level information available, enabling users to improve performance, detect bugs, and address incidents.
When an incident occurs—whether it is a bug, a production failure, or a potential security breach—users can access the relevant timeframe and inspect what happened across the entire cluster to identify the root cause.
You can see a live demo of Kubeshark (V1.00) here.