Kubeshark MCP: Network Traffic for AI Agents and Assistants
L4 flows, L7 API payloads, and full packet capture — accessible via the Model Context Protocol.
Network Traffic via MCP
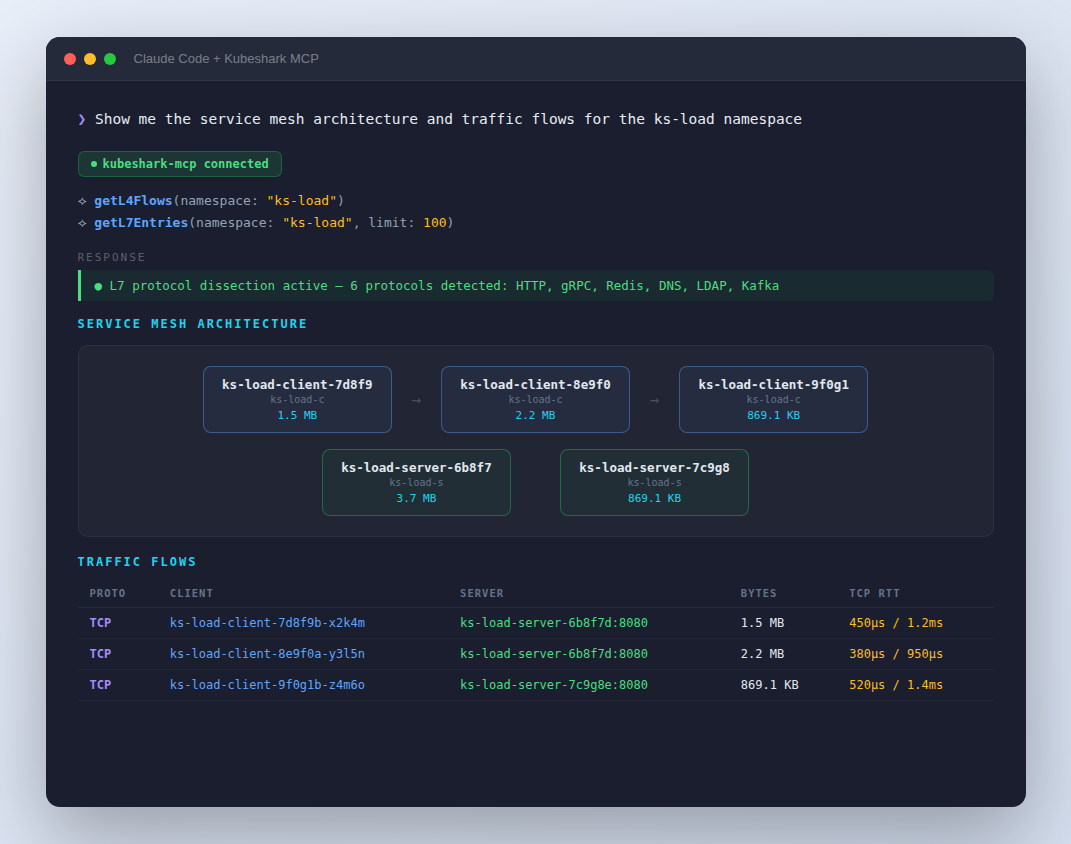
Kubeshark's MCP server surfaces Kubernetes network traffic — cluster-wide, across every node, at the speed and scale of Kubernetes.
Agents and assistants get direct access to API request/response payloads, TCP connection flows, packet-level data, and TLS-decrypted protocol dissection. All enriched with Kubernetes identity: pod, namespace, service, node, and labels on every packet.
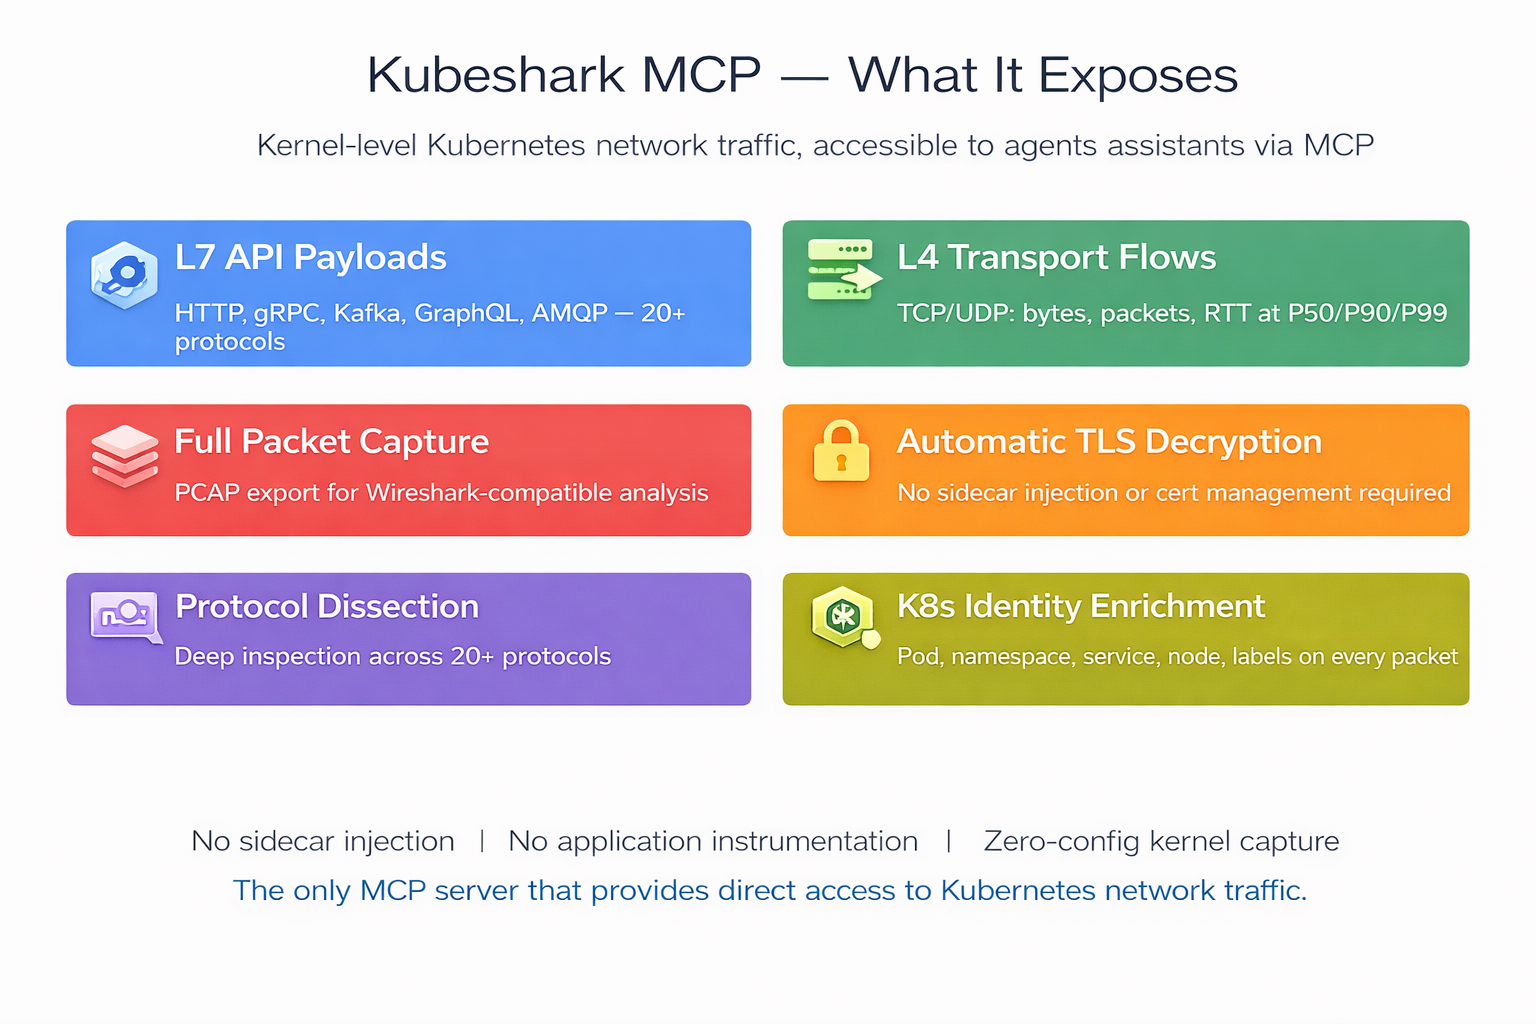
What Kubeshark MCP Exposes
L7 — Application Layer
Full request/response capture across 20+ protocols: HTTP/1.x, HTTP/2, gRPC, GraphQL, WebSocket, Kafka, AMQP, Redis, LDAP, DNS, and more. TLS decrypted automatically — no private key access required.
Per API call, agents and assistants receive the complete transaction:
L4 — Transport Layer
TCP/UDP flow-level metrics captured at the kernel. Per flow:
L4 Flow Summary — Cluster-Wide Connectivity
High-level connectivity overview aggregated across all nodes:
Kubernetes Identity Enrichment
Every packet and flow is tagged with:
- Pod name, namespace, service name, node name
- Pod labels (app, version, environment, etc.)
- Source and destination resolved — no manual IP-to-workload correlation
Forensic Capture
Point-in-time snapshots of all traffic, scoped by namespace or workload:
- Snapshot name, duration, creation timestamp
- Size in bytes, node count, packet count
- PCAP export for Wireshark-compatible offline analysis
API-Level Aggregate Statistics
Per-workload performance metrics:
MCP Tools
list_api_calls
Query L7 API transactions. Filters by protocol, status code, workload, namespace, and time range. Supports Kubeshark Filter Language (KFL) for advanced expressions (e.g. http and response.status >= 500). Returns method, path, headers, bodies, latency, and full K8s identity for source and destination.
list_l4_flows
List TCP/UDP flows with bytes transferred, packet counts, handshake RTT (P50/P90/P99), retransmission rates, and connection churn. Filter by service, pod, namespace, RTT threshold, or retransmission threshold.
get_l4_flow_summary
Cluster-wide connectivity overview: top talkers by volume, cross-namespace traffic, connection churn anomalies. Provides the big picture for capacity planning and anomaly detection.
get_api_stats
Aggregate API-level metrics: request count, error count, error rate, latency at P50/P99/max, throughput in requests per second, and top error status codes. Filter by workload, namespace, protocol, or time range. Sortable by latency, error rate, or throughput.
create_snapshot / list_snapshots / get_snapshot
Capture a named, time-bounded traffic snapshot scoped to a namespace or workload. List and retrieve existing snapshots with metadata: ID, name, creation time, size, duration, and status.
export_snapshot_pcap
Export a snapshot as a Wireshark-compatible PCAP file with full packet data. Returns file path, size, packet count, and export duration.
get_dissection_status / enable_dissection / disable_dissection
Check whether L7 protocol parsing is active, and toggle it on or off. Lists which protocols are currently being dissected.
get_data_boundaries
Check available data time ranges per node — earliest and latest captured data, retention window. Ensures queries target valid time ranges.
check_kubeshark_status
Verify that Kubeshark is running and accessible. Returns the list of available MCP tools.
Built-in Analysis Prompts
Kubeshark's MCP server also ships pre-built prompts for common analysis patterns:
How It Works
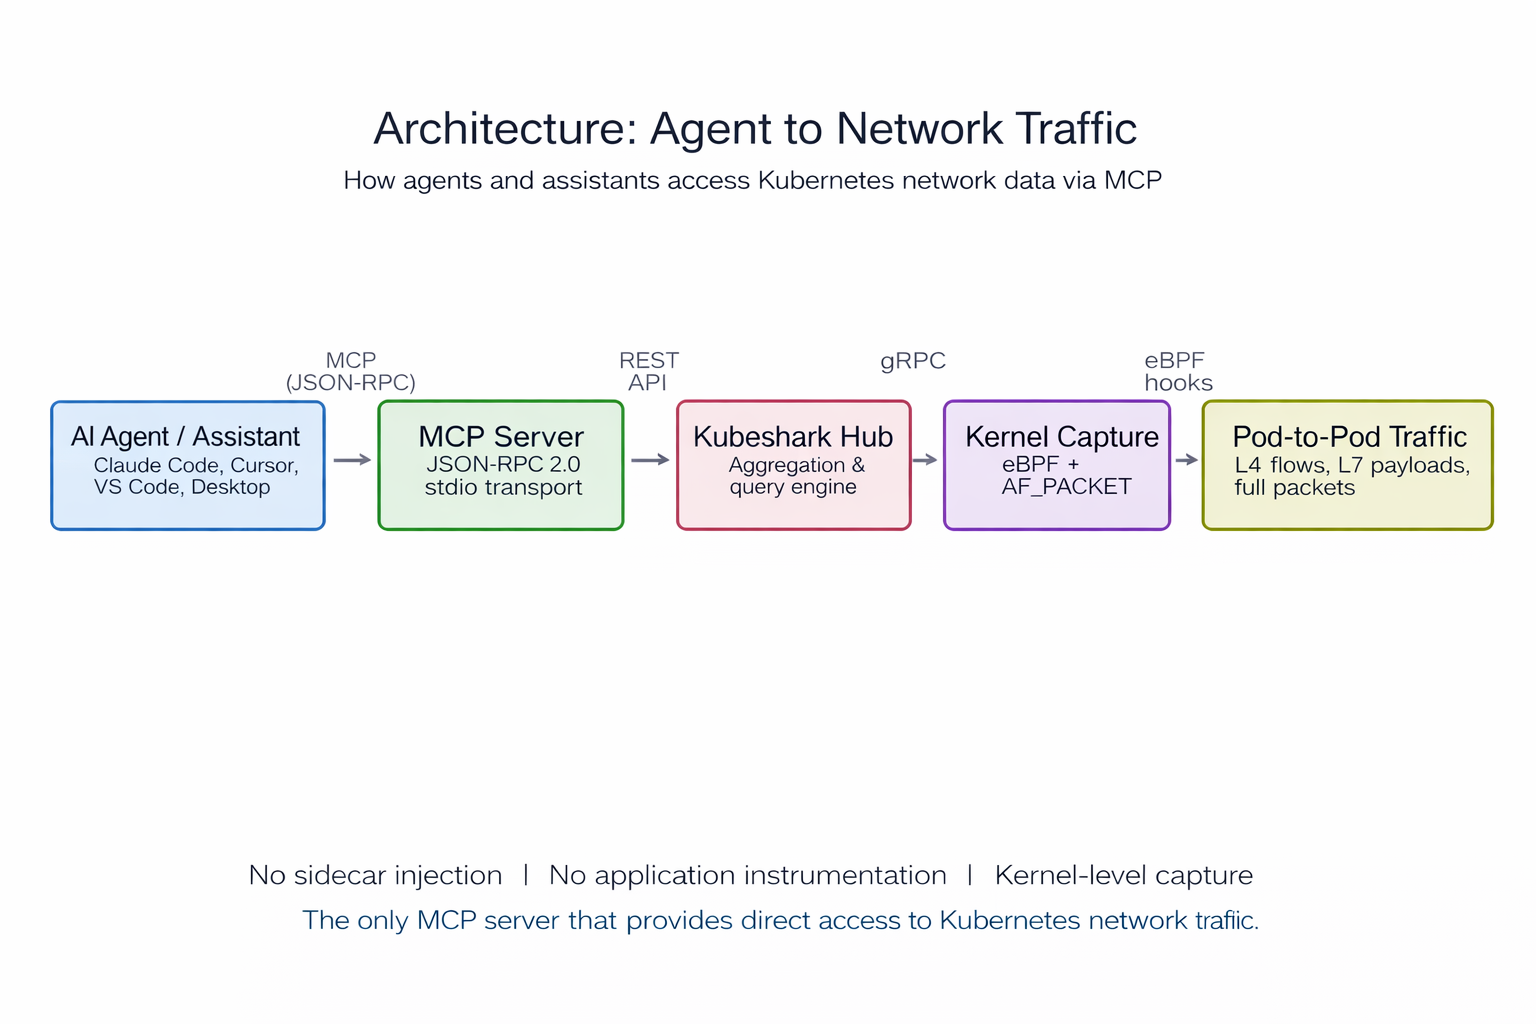
The agent or assistant connects to Kubeshark's MCP server via JSON-RPC 2.0 (stdio transport). The MCP server queries the Kubeshark Hub, which aggregates data from Workers running eBPF and AF_PACKET kernel-level capture on every node. No sidecar injection. No application instrumentation. Data stays on-premises — nothing is sent externally unless explicitly exported.
Example Queries
Prompts an agent or assistant can handle using the MCP tools above:
Incident Response
"List all 5xx responses from payment-service in the last 10 minutes"
→ list_api_calls with status code and workload filters
"Show TCP flows with handshake RTT above 100ms"
→ list_l4_flows filtered by RTT threshold
"Which services have the highest error rate right now?"
→ get_api_stats across all workloads, sorted by error percentage
"What's the big picture — who's talking to whom and how much?"
→ get_l4_flow_summary for top talkers and cross-namespace traffic
Performance Analysis
"Compare latency P99 for order-service before and after the last deploy"
→ get_api_stats with time-range filters, then compare_traffic prompt
"Find the slowest API endpoints across the cluster"
→ get_api_stats sorted by latency
"Show retransmission rates for inter-zone traffic"
→ list_l4_flows filtered by retransmission count
Security & Compliance
"Are any services sending Authorization headers to internal endpoints?"
→ list_api_calls filtered by header content, or security_audit prompt
"List all external egress connections from the production namespace"
→ list_l4_flows scoped to namespace, filtered by destination
"Audit all cross-namespace traffic for policy violations"
→ get_l4_flow_summary cross-namespace view
Forensics & Debugging
"Capture a traffic snapshot of the checkout namespace for post-mortem"
→ create_snapshot scoped to namespace, then export_snapshot_pcap
"Show me all gRPC calls between frontend and catalog-service"
→ list_api_calls filtered by protocol and workload pair
"Trace the full request path for a failing checkout request"
→ trace_request prompt with workload context
"What data do we have available — how far back can we query?"
→ get_data_boundaries for per-node retention windows
Service Topology & Capacity
"Map the service communication topology from live traffic"
→ show_topology prompt
Setup
Install Kubeshark:
Connect an agent or assistant (Claude Code):
Share with your team — commit .mcp.json to your repo:
Compatibility
Supported by Claude Code, Claude Desktop, Cursor, and VS Code + Continue.
Interactive Demo
* The above ☝️ is a recording of a live session
Kubeshark: 10.7K GitHub stars, 25M+ Docker pulls. Zero instrumentation required. Works on every Kubernetes distribution. kubeshark.com